Introduction: Over the lifetime of its Strategic Plan covering the period 2024 to 2028 the BJC will deliver services and projects across a wide area of North Dublin. In delivering the services the focus of both the targets group and the geographical area coved by the services will vary. For example, the provision of LAES services, funded by the DSP, will cover large parts of North Dublin, city and county incorporating Ballymun/Whitehall, Swords, Balbriggan, and surrounding areas. In contrast the delivery of the High Support service will be localised to the Ballymun regeneration area while the EU Projects will focus both on Ballymun Regeneration area and on the wider North Dublin LAES area. This paper provides a brief profile of the areas where the BJC will deliver the actions and services outlined in its Plan.
Balbriggan
The historic town of Balbriggan is located on the northern edge of Dublin’s Fingal administrative area. A coastal location, it’s approximately 32 km north of Dublin city. Balbriggan has experienced huge population growth in the early part of the 2000’s as a result the demand for housing within the wider Dublin region with hundreds of new homes being built. Change presents opportunities for the town, but also challenges such as ensuring that there is sufficient sustainable local employment available to support this growing population.
Balbriggan is the fastest growing town in Ireland, comprising two Electoral Districts (ED’s), Balbriggan Urban and Rural. The Rural ED experienced a 71% population growth from 9,615 in 2006 to 16,479 2016, making it one of four of the fastest growing electoral divisions in the State, more than double the population of the Urban ED.
Balbriggan railway station is at the northern limit of the Dublin suburban rail network. It acts as a major link for commuters into Dublin City Centre. The Balbriggan railway viaduct is considered one of the landmark features of the town. Alongside its sandy beach, Balbriggan also boasts a working Harbour. The river bracken runs through the town and was an important driver of the mills and factories. The beach itself is a key feature in this coastal town for swimmers, walkers, visitors alike.
Ballymun/Whitehall
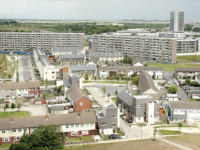
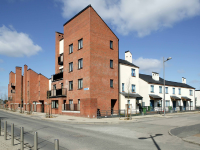
Whitehall is a Northside suburb of Dublin City, Ireland. Whitehall is a residential area on the northern outskirts of Dublin’s inner city, located near the M1 motorway leading to Dublin Airport, Swords and Belfast. It is situated between the suburbs of Santry, Drumcondra and Glasnevin. North of Whitehall, the M1 motorway begins at its junction with the M50, past the Dublin Port Tunnel’s northern entrance. The area is adjacent to the major public Beaumont Hospital and to Dublin City University on Collins Avenue. Ballymun, is largely a public housing area located on the north side of Dublin City, near Whitehall was built as part of a large public housing scheme by Dublin City Council in the 1960’s and early 1970’s. Intended as a ‘state-of-the-art’ and modern town, the scheme saw the construction of 2,814 flats in a series of 36 – 4, 8 and 15 story tower blocks – the first and only tower block scheme of its kind in Ireland – along with a further 2,400 houses, all within a 1.5 square mile radius. Over the years a lack of investment in the physical and social infrastructure of the area resulted in a significant degeneration of Ballymun’s physical environment, and the rise of serious social and economic disadvantage in the area. In 1996, a decision was made to demolish the high-rise tower blocks and replace them with low-rise housing. The regeneration of the area included the provision of an arts centre and a civic centre. In general, the physical regeneration largely completed.
Swords
Swords in County Dublin, is the county town of the local government area of Fingal, is a large suburban town on the east coast of Ireland, situated ten kilometres north of Dublin city centre. It is one of the largest urban areas in Ireland. Located on the Ward River, Swords features Swords Castle, a restored medieval castle, a holy well from which it takes its name, a round tower and a Norman tower. Facilities in the area include the Pavilions shopping centre, one of the largest in the Dublin region, a range of civic offices, some light industries, the main storage facility and archive of the National Museum of Ireland and several parks. Dublin Airport is located nearby.
Introduction
The LAES services covered in Dublin North (including Ballymun, Whitehall, Balbriggan and Swords) and covers the areas supported by the DSP INTREO Centres and branch offices. The areas covered by Swords includes Swords, Malahide , Kinsealy, Oldtown, Rolestown, Ballyboughil, Donabate, Portrane. Balbriggan includes Balbriggan urban and rural as well as Rush, Lusk, Stamullen, Garristown and Skerries. The Ballymun INTREO includes Ballymun, Northwood, Geraldstown Woods, Domvile Woods, Oldtown Wood, Shanard, Shanowen, Shanliss, parts of Ballymun Road, Milners Square, Santry Cross, Parts of Swords Road, Grace Park Road, Drumcondra Dublin 9, Glasnevin Dublin 9, Hampton Wood Dublin 11 and Mayeston Dublin 11.
Population and Gender
According to the 2022 Census the total population of the Dublin North LEAS area is 219,457. Of the three areas covered by the LAES (Swords, Balbriggan and Ballymun/Whitehall) Swords makes up 42% of the population, Balbriggan 33% and Ballymun/Whitehall 25%. Males account for 49% and females 51%. In general, the area reflects the national male/female breakdown. (See Table 1.1 and 1.2).
Table 1.1: Population: Ballymun/Whitehall, Swords, and Balbriggan LAES Areas Census 2022 (rounding used)
| Ballymun/Whitehall LEAS Area | Swords LAES Area | Balbriggan LAES Area | Total LAES Area |
Population | 55,247 | 92,353 | 71,857 | 219,457 |
Population Aged 15/64 |
37,608 |
62,584 |
47,406 |
147,598 |
Population 15+ | 46,408 | 72,296 | 54,817 | 173,475 |
Table 1.2: Gender Breakdown, Percentage, Census 2022 (rounding used)
Location | Male | Female |
Ballymun/Whitehall | 48% | 52% |
Balbriggan | 49% | 51% |
Swords | 49% | 51% |
LAES Area | 49% | 51% |
National | 49% | 51% |
Age Profile
As outlined in Table 1.3 overall, the age profile of the LAES area reflects the National age profile. There are differences, for example, there is a lower percentage of retirees in the LAES Area, Balbriggan and Swords than nationally. Ballymun/Whitehall has a higher percentage of retirees than Balbriggan or Swords.
Table 1.3: Age Profile, LAES Areas and National (Percentage, Census 2022, rounding used)
Age Range | Ballymun /Whitehall | Balbriggan | Swords | LAES Area | National |
0-14 | 16% | 24% | 22% | 21% | 20% |
15-29 | 22% | 18% | 18% | 18% | 18% |
30-44 | 23% | 22% | 25% | 24% | 22% |
45-64 | 23% | 25% | 25% | 25% | 25% |
64+ | 16% | 11% | 10% | 12% | 15% |
At 24% Balbriggan has the highest percentage of 0–14-year-olds, four percent above the national figure while Ballymun/Whitehall at 16% has the lowest percentage in the age group, four percent below the national percentage. Nationally 65% of the population are aged between 15 and 64. This compares to 67% for the LAES area, 68% for Ballymun/Whitehall and Swords. At 65% Balbriggan has the same percentage as the national figure.
Employment, Unemployment, and the Labour Force
Based on the Census 2022 and Principle Economic Status (PES) data the employment rate for the LAES area was one percent higher than the national rate. Of the three areas that make up LAES Dublin North Swords had the highest Employment Rate and Balbriggan the lowest. The Labour Force Participation Rate was higher in the LAES area than the National rate with Swords 7% higher than the National Rate of 61%. Ballymun/Whitehall had the highest unemployment rate and Swords the lowest. (See Table 1.4)
Table 1.4: Labour Force Participation, Employment, Unemployment: Ballymun/Whitehall, Swords and Balbriggan LAES Areas, Total LAES Area and National, (CSO: Census 2022, Principal Economic Status (PES) rounding used)
| Ballymun/Whitehall LAES Area | Swords LAES Area | Balbriggan LAES Area | Total LAES Area | National |
Labour Force | 28,690 | 49,010 | 34,877 | 112,577 | 2,531,099 |
Labour Force Participation Rate |
62% |
68% |
64% |
65% |
61% |
Employment Rate |
69% |
73% |
68% |
70% |
69% |
Unemployment Rate |
10% |
7% |
8% |
8% |
8% |
The National Quarterly Household Survey of Quarter Four 2023 at a national level the Labour Force Participation Rate is 65%, the Employment Rate is 74% and the Unemployment rate is 4%. (Source: CSO, NQHS Q4 2023, ILO Criteria).
Table 1.5: Male/Female, Labour Force Participation, Employment, Unemployment: Ballymun/Whitehall, Swords, and Balbriggan LAES Areas and National (Census 2022, Principal Economic Status (PES) rounding used)
| Ballymun/ Whitehall | Swords | Balbriggan | National | ||||
| Male | Female | Male | Female | Male | Female | Male | Female |
Labour Force Participation Rate |
68% |
57% |
75% |
63% |
70% |
58% |
67% |
56% |
Employment Rate |
72% |
65% |
78% |
68% |
74% |
62% |
75% |
63% |
Unemployment Rate |
11% |
9% |
6% |
7% |
8% |
8% |
9% |
8% |
Table 1.5 give the gender breakdown of the Labour Force Participation Rate, the Employment Rate and the Unemployment Rate for each of the three LAES areas. Swords has the highest male (75%) and female (63%) Larbour Market participation rate. Both rates are above the national rate, with the male rate 8% higher and the female rate 7% higher. This compares to Ballymun/Whitehall area where the both the male and female Labour Mark participation rate is 1% higher than the National rate. The Balbriggan female employment rate at 62% is lower than the two other areas and one percent below the national rate. The Ballymun/Whitehall
male employment rate is the lowest and is three percentage points lower than the National rate. Swords has the highest employment rate for both men and women. Ballymun/Whitehall has the highest unemployment rate for both men (11%) and women (9%) and are above the National rate. Reflecting the higher employment rate the male rate of unemployment is the lowest at 6%, three percent below the National rate.
Education Levels
There is a well-established relationship between a person’s level of educational attainment and poverty, future earing potential, income, employment opportunities, and quality of life. Levels of e education influence factors such as health, civic engagement, social connections and happiness. Educational attainment is central to the intergenerational transmission of poverty. The ESRI points out that those who grow up in poverty attain lower levels of education and this accounts for over a quarter of the association between childhood poverty and deprivation in adulthood. (Intergenerational Poverty in Ireland, Research Series 150, October 2022).
Table 1.6: Education: Population aged 15 years and over and highest level of education completed Ballymun/Whitehall, Swords, Balbriggan, LAES Area and National, Percentages, excluding not stated rounding used (CSO: 2022 Census)
| Ballymun/Whitehall |
Swords |
Balbriggan | Total LAES Area | National |
No formal/Primary/Lower Secondary |
28% |
16% |
21% |
20% |
25% |
Upper Secondary | 19% | 20% | 21% | 20% | 19% |
Tech/Voc./Advanced, Higher Cert/Apprentice |
17% |
20% |
22% |
20% |
20% |
Ordinary Degree/Professional Qualification or both |
8% |
10% |
10% |
10% |
9% |
Honours Degree/Professional qualifications or both |
14% |
18% |
14% |
16% |
14% |
PhD/Post Graduate Diploma/Degree |
14% |
16% |
12% |
14% |
13% |
|
|
|
|
|
|
Not Stated (N/S) | 11% | 6% | 5% | 7% | 7% |
Total including N/S | 28,327 | 58,556 | 43,117 | 130,000 | 3,384,629 |
As Table 1.6 shows educational attainment in the LAES area reflects the national level of attainment or is a little above the national level. For example, the percentage with “No formal, Primary, Lower Secondary” education is five percent below the national rate of 25%. However, in the Ballymun/Whitehall area 28% have “No formal, Primary, Lower Secondary” education. The Swords area has the highest level of educational attainment, followed by Balbriggan and then Ballymun/Whitehall area. For example, at 18% Swords has the highest percentage with an Honours Degree, Professional qualifications or both which is four percent above the national percentage of 14%. The Balbriggan area has the highest percentage (22%) of individuals who have achieved technical, vocational, advanced, higher cert and/or completed an apprenticeship. The percentage of the population over 15 years with an Ordinary Degree/Professional qualification or both or higher is 36% in Ballymun/Whitehall, 44% in Swords, 36% in Balbriggan and 40 % across the LAES area. The national percentage is 36%.
Housing
The total number of private households in the Dublin North LAES area is 74,481 (see Table 1.7). Of these 65% are owned outright or with a mortgage, 19% are rented from private landlords and 9% are rented from the Local Authority. The area with the highest percentage of households renting from private landlords is Swords (21%) followed by Ballymun/Whitehall (20%) with 13% in Balbriggan rented from private landlords. Balbriggan has the highest percentage of households owned outright or by a mortgage (71%). This is above the Nation rate of 66%. Ballymun/Whitehall at 55% has the lowest percentage of households owned outright or with a mortgage, ten percentage points below the national rate.
Table 1.7: Housing: Private Households Percentage and Total Number of Households: Ballymun/Whitehall, Swords, and Balbriggan LAES Areas and National (Census 2022, rounding used)
| Ballymun/ Whitehall | Swords | Balbriggan | Total LAES Area | National |
Number of Private Households |
20,388 |
30,780 |
23,313 |
74,481 |
1,836,728 |
Rented from Local Authority |
16% |
5% |
9% |
9% |
8% |
Rented from Private Landlords |
20% |
21% |
13% |
19% |
18% |
Owned outright or with Mortgage |
55% |
68% |
71% |
65% |
66% |
A total of 18% of the population in the LAES area (40,571) live in households rented from private landlords. Sixth four percent (64%, (141,197)) of the population in the LAES area live in household owned outright or with a mortgage. A further 9% of the population (19,751) live in households rented from the Local Authority, either Dublin City Council or Fingal County Council. The survey on Income and Living Conditions (SILC) published by the CSO confirms consistent poverty in one-parent families rose to 14.1% in 2022, almost three times the rate of the general population (5%). Deprivation in one-parent families remains high with almost half (43.5%) of households with one adult with children under 18 years of age living in deprivation, this compares to 17.7% of people in two-parent households. One parent family household account for 11% of all households in the State. Table 1.8 shows that the three areas making up the Dublin North LAES all have percentages of one parent family households equal to or higher than the national percentage.
Table 1.8: One Parent Family Households Percentage and Total Number of Households and Persons in the Household: Ballymun/Whitehall, Swords, and Balbriggan LAES Areas and National (Census 2022, rounding used)
| Ballymun/ Whitehall | Swords | Balbriggan | Total LAES Area | National |
One Parent Family Households |
2,987 |
3,427 |
3,267 |
9,681 |
209,523 |
As Percentage of all Households |
14% |
11% |
14% |
13% |
11% |
Persons in One Parent Family Households |
8,645 |
9,824 |
9,581 |
28,050 |
421,847 |
As Percentage of all Persons |
16% |
11% |
13% |
13% |
8% |
Persons living in one parent family households in Ballymun/Whitehall make up 16% of all persons which is twice the National rate. Balbriggan is the next highest with 13% of all persons living in one parent family households.
Occupation
Table 1.9 shows the percentage for a range of occupations across the Dublin North LAES area and the National percentages. The percentages are calculated after the “not stated” are excluded. This is because of the relatively high number who did not state an occupation particularly in the Ballymun/Whitehall area where “not stated” accounted for 16% of the total. This compares with 8% in Balbriggan and Swords and 11% nationally.
Table 1.9: Occupations: Ballymun/Whitehall, Swords and Balbriggan LAES Areas and Nationally, Percentages, excluding “Not Stated” (Rounding used. Census 2022 CSO)
| Ballymun/Whitehall | Swords | Balbriggan | Total LAES Area | National |
Managers/Directors/Senior Managers |
8% |
11% |
9% |
11% |
9% |
Professional/Associate Professional/Technical |
40% |
41% |
33% |
38% |
36% |
Admin/Sec | 12% | 12% | 13% | 12% | 10% |
Skilled Trades | 8% | 8% | 12% | 9% | 14% |
Services (caring, sales, leisure, customer) |
15% |
15% |
17% |
15% |
15% |
Operators (process, plant, machine) |
6% |
6% |
8% |
6% |
8% |
Elementary | 11% | 7% | 9% | 9% | 8% |
Not stated (Number and percentage) | 4,585 (16%) | 3,958 (8%) | 2,688 (8%) | 11,231 (10%) | 247,044 (11%) |
Total (Number) | 28,289 | 48,477 | 34,413 | 111,179 | 2,496,573 |
Professional/Associate Professional/Technical is the top occupation both nationally and in the LAES Dublin North area. At 41% Swords is the highest percentage followed by Ballymun/Whitehall and Balbriggan which at 33% has the lowest percentage of Professional/Associate Professional/Technical occupations. Balbriggan is three percent below the National percentage while Swords is five percent above the National.
The second highest occupation is Services (caring, sales, leisure, customer) (15%, Dublin North LAES area) followed by Administrative/Secretarial (12%, Dublin North LAES Area). Both these occupations have a higher percentage in Balbriggan (Services, 17% and Admin/Sec 13%) than in Swords and Ballymun/Whitehall. At 12% Skills Trades is four percent higher in Balbriggan than Ballymun/Whitehall or Swords. Elementary occupations are highest in Ballymun/Whitehall than either of the other two areas and nationally. These occupations at 11% are five percent higher in Ballymun/Whitehall than the National percentage of eight.
Gender and Occupation
Table 1.10 and 1.11 shows the ranking of occupations for males and females. In all three locations and nationally the top two occupations for males are Professional/Associate Professional/Technical followed by Skilled Trades. For females in the three locations and nationally the top three occupations are the same i.e. Professional/Associate Professional/Technical, Services (caring, sales, leisure, customer), and Administrative/Secretary. For males Administrative/Secretary was the least occupation while for females it was Skilled Trades.
In all three locations males accounted for over 90% of all Skilled Trades occupations. Males made up 87% of Operators in Ballymun/Whitehall, 86% in Balbriggan and 85% in Swords. Females made up 70% of the Services occupation in Swords, 73% in Balbriggan and 69% in Ballymun/Whitehall locations. Females also dominate the Administrative/Secretary occupations with 73% in Swords, 75% in Balbriggan and 71% in Ballymun/Whitehall.
Table 1.10: Ranking of Occupations Females: Ballymun/Whitehall, Swords and Balbriggan LAES Areas and Nationally, Percentages, excluding “Not Stated” (Rounding used. Census 2022 CSO)
Rank | Ballymun/Whitehall | Swords | Balbriggan | National |
1 | Professional/Associate Professional/Technical 42% | Professional/Associate Professional/Technical 40% | Professional/Associate Professional/Technical 34% | Professional/Associate Professional/Technical 38% |
2 | Services (caring, sales, leisure, customer) 21% | Services (caring, sales, leisure, customer) 22% | Services (caring, sales, leisure, customer) 27% | Services (caring, sales, leisure, customer) 24% |
3 | Admin/Sec 17% | Admin/Sec 18% | Admin/Sec 20% | Admin/Sec 17% |
4 | Elementary 9% | Managers/Directors/ Senior Managers 9% | Managers/Directors/ Senior Managers 8% | Elementary 8% |
5 | Managers/Directors/ Senior Managers 7% | Elementary 7% | Elementary 7% | Managers/Directors/ Senior Managers 7% |
6 | Operators (process, plant, machine) 2% | Operators (process, plant, machine) 2% | Operators (process, plant, machine) 2% | Operators (process, plant, machine) 3% |
7 | Skilled Trades 2% | Skilled Trades 2% | Skilled Trades 2% | Skilled Trades 3% |
Table 1.11: Ranking of Occupations Males: Ballymun/Whitehall, Swords and Balbriggan LAES Areas and Nationally, Percentages, excluding “Not Stated” (Rounding used. Census 2022 CSO)
Rank | Ballymun/Whitehall | Swords | Balbriggan | National |
1 | Professional/Associate Professional/Technical 39% | Professional/Associate Professional/Technical 39% | Professional/Associate Professional/Technical 33% | Professional/Associate Professional/Technical 31% |
2 | Skilled Trades 14% | Skilled Trades 15% | Skilled Trades 21% | Skilled Trades 24% |
3 | Elementary 13% | Managers/Directors/ Senior Managers 13% | Operators (process, plant, machine) 14% | Operators (process, plant, machine) 13% |
4 | Operators (process, plant, machine) 10% | Operators (process, plant, machine) 10% | Elementary 11% | Elementary 10% |
5 | Services (caring, sales, leisure, customer) 9% | Elementary 9% | Managers/Directors/ Senior Managers 11% | Managers/Directors/ Senior Managers 9% |
6 | Managers/Directors/ Senior Managers 8% | Services (caring, sales, leisure, customer) 8% | Services (caring, sales, leisure, customer) 9% | Services (caring, sales, leisure, customer) 8% |
7 | Admin/Sec 7% | Admin/Sec 6% | Admin/Sec 6% | Admin/Sec 5% |
In the Ballymun/Whitehall location 42% of females stated Professional/Associate Professional/Technical as their occupation with 39% of males stating this as their occupation. In Swords males gave Professional/Associate Professional/Technical as their occupation with 40% of females stating this as their occupation. In Balbriggan 34% of females stated Professional/Associate Professional/Technical as their occupation with 33% of males stating this as their occupation. Ballymun/Whitehall had a higher percentage of Professional/Associate Professional/Technical occupations than the National percentage.
Industry
Professional Services is the industry that employs the highest percentage at a national level and for individuals living in the Ballymun/Whitehall location. Commerce and Trade is the industry that employs the highest percentage of individuals living in Swords and Balbriggan and in the North Dublin LAES area. The Transport and Communications industries also employs a high percentage of individuals living in the LAES area with Swords 7% higher than the national percentage of 9%. The percentage employed in manufacturing is 5% lower than the national rate of 12% in each of the locations and the LAES area. Other then Agriculture, forestry, and Fishing, the percentage in building and Construction is the second lowest employing 4% in each of Ballymun/Whitehall and Swords, 6% in Balbriggan and 5% in the LAES area. This compares to a national percentage of 6%. (See Table 1.12).
Table 1.12: Industry: Ballymun/Whitehall, Swords and Balbriggan LAES Areas and Nationally, Percentages, (Rounding used. Census 2022 CSO)
| Ballymun/Whitehall | Swords | Balbriggan | Total LAES Area | National |
Professional Services | 28% | 23% | 24% | 25% | 24% |
Commerce and Trade | 24% | 29% | 27% | 27% | 23% |
Other | 18% | 14% | 13% | 15% | 17% |
Manufacturing Industries | 7% | 7% | 7% | 7% | 12% |
Transport and Communications |
13% |
16% |
14% |
14% |
9% |
Building and Construction | 4% | 4% | 6% | 5% | 6% |
Public Administration | 7% | 6% | 7% | 6% | 5% |
Agriculture, forestry, and Fishing |
0% |
1% |
2% |
1% |
4% |
Total (Number) | 25,816 | 45,740 | 31,278 | 102,834 | 2,320,297 |
Table 1.13 and 1.14 shows the ranking of industry by gender. The top three industries for females are Professional Services, Commerce and Trade and Other industries. This is the same in all three LAES areas. The ranking is the same order as the national ranking for females. At a national level eight percent of females work in manufacturing industries. This is ranked fourth at a national level. In the three LAES areas manufacturing industries is ranked sixth in the three LAES areas with 4% of females in Ballymun/Whitehall employed in manufacturing and five percent in both Swords and Balbriggan. Building and Construction Industries account for only 1% of females.
Table 1.13: Ranking of Industry by Gender Females: Ballymun/Whitehall, Swords and Balbriggan LAES Areas and Nationally, Percentages, excluding “Not Stated” (Rounding used. Census 2022 CSO)
Rank | Ballymun/Whitehall | Swords | Balbriggan | National |
1 | Professional Services 40% | Professional Services 34% | Professional Services 37% | Professional Services 38% |
2 | Commerce and Trade 23% | Commerce and Trade 28% | Commerce and Trade 27% | Commerce and Trade 24% |
3 | Other 17% | Other 14% | Other 13% | Other 17% |
4 | Transport/ Communication 8% | Transport/ Communication 12% | Transport/ Communication 8% | Manufacturing Industries 8% |
5 | Public Administration 7% | Public Administration 6% | Public Administration 8% | Public Administration 6% |
6 | Manufacturing Industries 4% | Manufacturing Industries 5% | Manufacturing Industries 5% | Transport/ Communication 5% |
7 | Building and Construction 1% | Building and Construction 1% | Building and Construction 1% | Building and Construction 1% |
8 | Agriculture, forestry, and Fishing 0% | Agriculture, forestry, and Fishing 0% | Agriculture, forestry, and Fishing 1% | Agriculture, forestry, and Fishing 1% |
The top three industries for males are more mixed. (See Table 1.14). In Swords and Balbriggan, the top three industries are the same with Commerce and Trade, Transport/ Communication and Other. In Ballymun/Whitehall area the top three are Commerce and Trade, Other and Professional Services. Of interest at a National level Manufacturing Industries at 15 % is the second industry employing males. In contrast Manufacturing Industries account for only 7% in Ballymun/Whitehall, 9% in Swords and 10% in Balbriggan.
Table 1.14: Ranking of Industry by Gender Males: Ballymun/Whitehall, Swords and Balbriggan LAES Areas and Nationally, Percentages, excluding “Not Stated” (Rounding used. Census 2022 CSO)
Rank | Ballymun/Whitehall | Swords | Balbriggan | National |
1 | Commerce and Trade 26% | Commerce and Trade 29% | Commerce and Trade 27% | Commerce and Trade 24% |
2 | Other 19% | Transport/ Communication 21% | Transport/ Communication 18% | Manufacturing Industries 15% |
3 | Professional Services 17% | Other 14% | Other 13% | Other 15% |
4 | Transport/ Communication 17% | Professional Services 13% | Professional Services 13% | Professional Services 13% |
5 | Public Administration 7% | Manufacturing Industries 9% | Manufacturing Industries 10% | Transport/ Communication 12% |
6 | Manufacturing Industries 7% | Building and Construction 7% | Building and Construction 9% | Building and Construction 10% |
7 | Building and Construction 7% | Public Administration 6% | Public Administration 7% | Agriculture, forestry, and Fishing 6% |
8 | Agriculture, forestry, and Fishing 0% | Agriculture, forestry, and Fishing 1% | Agriculture, forestry, and Fishing 3% | Public Administration 5% |
Nationality (Place of Birth)
In terms of nationality profile of the LAES areas in general they reflect the National profile based on place of birth. Swords is the area with a more diverse nationality profile with 25% of the population stating they place of birth as outside of Ireland. This compares to 20% nationally. Ballymun/Whitehall area reflects the national profile. (See Table 1.15).
Table 1.15: Nationality (Place of Birth): Ballymun/Whitehall, Swords and Balbriggan, LAES Areas and Nationally, Percentages, (Rounding used. Census 2022 CSO)
| Ballymun/Whitehall | Swords | Balbriggan | Total LAES Area | National |
Ireland | 79% | 75% | 79% | 78% | 80% |
UK | 4% | 5% | 4% | 4% | 6% |
Poland | 2% | 3% | 3% | 2% | 2% |
India | 2% | 2% | 1% | 1% | 1% |
Other EU | 5% | 7% | 6% | 6% | 4% |
Rest of World | 8% | 8% | 7% | 9% | 7% |
Total (Number) | 54,628 | 91,114 | 71,332 | 217,074 | 5,084,879 |
Welfare Schemes
One of the main indicators of exclusion is the level of welfare dependency either fully or in part among the members of a community. Information from the Department of Social Protection (DSP) shows the number on the main social welfare schemes for the Ballymun, Balbriggan and Swords DSP offices. (See Diagram 1.1) In April 2024 there was a total of 9,394 on a welfare scheme in the three offices. The scheme with the largest number of recipients was One Parent Family Payment including those on OFP Job Seeker Transition. There was a total of 3,198 on these schemes including 964 on OFP Job Seeker Transition. The scheme with the next highest number of recipients is UA including UA Part-Time Job Incentive, Optional JA and JA P65. There was a total of 2,712 on these schemes which includes 2,289 on UA. There was a total of 1,871 on UB scheme and a further 624 on UBCO scheme making a total of 2,495 on these two schemes.
Introduction
This section is a profile of the Ballymun area based on the 2022 Census and compared to the national data. Each location where the BJC provides services has challenges, Ballymun is a location experiencing higher levels of unemployment, educational disadvantage and lower employment rates. The higher level of disadvantage tends to be lost in the overall Whitehall/Ballymun data and the data for the wider LAES area. It is also useful to separate the Ballymun profile as some of the projects and programmes delivered by the BJC are supported by organisations with a focus on Ballymun only.
Ballymun A/D
Ballymun, located on the north side of Dublin City, was built as part of a large public housing scheme by Dublin City Council in the 1960’s and early 1970’s in response to the significant housing shortages in the city at the time. Intended as a ‘state-of-the-art’ and modern town, the scheme saw the construction of 2,814 flats in a series of 36 – 4, 8 and 15 story tower blocks – the first and only tower block scheme of its kind in Ireland – along with a further 2,400 houses, all within a 1.5 square mile radius. Over the years a lack of investment in the physical and social infrastructure of the area resulted in a significant degeneration of Ballymun’s physical environment, and the rise of serious social and economic disadvantage in the area. In 1996, a decision was made to demolish the high-rise tower blocks and replace them with low-rise housing. Ballymun Regeneration Ltd was set up by Dublin City Council and charged with the task of regenerating the physical, infrastructure of the entire area. The four ‘electoral divisions’ (or EDs) of Ballymun A, B, C, D.
Ballymun A/D: Population
The population of the four Ballymun Electoral Division A to D is 18,288. The population is relatively young with 18% of the population under 15 years of age. As outlined in Table 2.1 the labour force participation rate is higher than the National rate.
Table 2.1: Population, and Labour Force: Ballymun A/D, (CSO: 2022 Census)
Population | 18,288 |
Population Aged 15/64 | 13,139 |
Population Aged 15+ | 14,996 |
Labour Force | 9,638 |
Ballymun A/D: Employment and Unemployment
Table 2.2 shows the employment, unemployment and labour force participation rate for Ballymun A/D and nationally. The employment rate at 60% is below the national rate while the labour force participation rate is above the national rate. When compared to the other areas Ballymun A/D has a lower employment rate than the other locations across the area covered by the LAES. The employment rate in Ballymun/Whitehall is 69%, Swords 73% and Balbriggan 68%.
Table 2.2: Percentage Employment, Unemployment and Labour Force Participation: Ballymun ED: A/D and National, (CSO: Census 2022, Principal Economic Status (PES) rounding used)
| Ballymun A/D | National |
Labour Force Participation Rate | 64% | 61% |
Employment Rate | 60% | 69% |
Unemployment Rate | 18% | 8% |
The 2022 Census shows a national unemployment rate of 8%. At the time of the Census the rate of unemployment in the community covered by Ballymun A/D was 18%. This is over twice the national rate and higher than the rate of unemployment in the other areas covered by the LAES with Swords having the lowest rate of unemployment. (See Diagram 2.1)
Ballymun A/D: Housing
The housing profile of Ballymun A/D is different to the other locations in the area covered by the LAES and is also different to the national profile in that most private households are rented from the Local Authority (See Diagram 2.2). Nationally 8% of the private households are rented from the Local Authorities, in Swords the percentage renting from the Local Authority is 5%. In contrast in Ballymun A/D the percentage of private households renting from the Local Authority is 41%.
Most the private households are owned outright or with a mortgage. Nationally 66% of the private households are owned outright or with a mortgage, in Balbriggan the percentage is higher at 71%, in Swords 68% are owned outright or with a mortgage. In the Ballymun/Whitehall area 55% of the private households are owned outright or with a mortgage. This lower percentage is primarily the Ballymun A/D area where private households owned outright or with a mortgage is 28%.
Ballymun A/D: One Parent Households
As stated above deprivation in one-parent families remains high when compared to people in two-parent households. In comparison to other areas cover by the LAES Ballymun A/D has a higher percentage of households and persons in one parent family household. In terms of persons in one parent family households (See Diagram 2.3 and Table 2.3). Ballymun A/D at 28% it has over three times the national rate of eight percent and over twice (26%) the rate of one parent households than the national rate of 11%. Swords at 11% has the lowest rate of one parent households and persons in households that the other areas covered by the LAES.
Table 2.3: Percentage of One Parent Family Households and Persons: Ballymun ED: A/D and National (CSO: Census 2022, rounding used)
| Ballymun A/D | National |
As Percentage of all Households | 26% | 11% |
As Percentage of all Persons | 28% | 8% |
Ballymun A/D: Education
As indicated above, one’s level of education is an influencing factor on a range of factors that determines life chances, income, quality of life, housing, health, etc. In comparison to the national and the LAES area, (Swords, Ballymun/Whitehall and Balbriggan), Ballymun A/D has a lower level of education (See Table 2.4 and Diagram 2.4). In the Ballymun A/D area 41 % of the population aged 15 years and over had no formal education completed or only completed Primary or Lower Secondary compared to 25% nationally. This compares to 16% in Swords, 28% in Ballymun/Whitehall and 21% in Balbriggan. At a national level 36% of the population aged 15 years or over had completed an Ordinary Degree/National Diploma or both or higher compared to 17% in Ballymun A/D. The percentage of the population over 15 years with an Ordinary Degree/Professional qualification or both or higher is 36% in Ballymun/Whitehall, 44% in Swords, 36% in Balbriggan and 40 % across the LAES area. The national percentage is 36%.
Table 2.4: Education: Highest Level of Formal Education Ceased, Ballymun A/D, and National, Percentages, excluding not stated (CSO: 2022 Census)
| Ballymun A/D | National |
No formal/Primary/Lower Secondary | 41% | 25% |
Upper Secondary | 24% | 19% |
Tech/Voc./Advanced, Higher Cert/Apprentice | 18% | 20% |
Ordinary Degree/National Diploma | 5% | 9% |
Higher Degree/Professional qualifications | 7% | 14% |
PhD/Post Graduate Diploma/Degree | 5% | 13% |
|
|
|
Not stated | 18% | 7% |
Total (Number) | 11,889 | 3,384,629 |

Ballymun A/D: Occupation
As outlined below in Table 2.5 the occupational profile of Ballymun A/D is in jobs that are low skills and in turn low paid. Elementary occupations and occupations in the Services (caring, sales, leisure, customer) jobs account for 41% of all occupations in Ballymun A/D. At a national level these two occupational groups make up 23% of occupations. In the LAES Dublin North area, the percentage making up the two occupation groups Elementary and Services (caring, sales, leisure, customer) is 24% with Ballymun/Whitehall at 26%, Balbriggan at 25% and Swords at 22%.
Table 2.5: Percentage Occupations Employed and Unemployed: Ballymun ED: A/D, and National, excluding not stated rounding used (CSO: 2022 Census)
| Ballymun A/D | National |
Managers/Directors/Senior Managers | 5% | 9% |
Professional/Associate Professional/Technical | 21% | 36% |
Admin/Sec | 11% | 10% |
Skilled Trades | 10% | 14% |
Services (caring, sales, leisure, customer) | 23% | 15% |
Operators (process, plant, machine) | 10% | 8% |
Elementary | 20% | 8% |
|
|
|
Not stated | 33% | 11% |
Total (Number) | 9,402 | 2,496,573 |
Diagram 2.5 shows the top three occupations in Ballymun A/D compared to Swords, Balbriggan, Ballymun/Whitehall and nationally. In Ballymun A/D the top three occupations fall into the following categories, Services (caring, sales, leisure, customer) (23%), followed by Professional/Associate Professional/Technical (21%) and then Elementary (20%). In Swords LAES area Elementary occupations is 7% compared to 20% in Ballymun A/D while Professional/Associate Professional/Technical occupations is 41% in Swords it is 21% in Ballymun A/D and 40% in Ballymun/Whitehall LAES area. In Ballymun A/D Services (caring, sales, leisure, customer) at 23% is the occupational group with the highest percentage. In Swords LAES area this occupational group accounts for 15%, the same percentage in Ballymun/Whitehall and Nationally while Balbriggan is 17%.

Ballymun A/D: Industry
In Ballymun A/D at 27% Professional Services is the industry type where most work. This is the same as Ballymun/Whitehall (28%) and nationally (24). In Swords (29%) and Balbriggan (27%) Commence and Trade is the top industry where most work. In Ballymun A/D Other industries account for 26% while Other is 17% nationally, 18% in Ballymun/Whitehall, 14% in Swords and 13% in Balbriggan. Overall, the industries where individuals work is like the national and the LAES Dublin North area. (See Table 2.6)
Table 2.6: Industry: Ballymun/Whitehall, Swords and Balbriggan, Ballymun A/D and Nationally, Percentages, (Rounding used. Census 2022 CSO)
| Ballymun/Whitehall | Swords | Balbriggan | Ballymun A/D | National |
Professional Services | 28% | 23% | 24% | 27% | 24% |
Commerce and Trade | 24% | 29% | 27% | 22% | 23% |
Other | 18% | 14% | 13% | 26% | 17% |
Manufacturing Industries | 7% | 7% | 7% | 6% | 12% |
Transport and Communications |
13% |
16% |
14% |
11% |
9% |
Building and Construction | 4% | 4% | 6% | 4% | 6% |
Public Administration | 7% | 6% | 7% | 4% | 5% |
Agriculture, forestry, and Fishing |
0% |
1% |
2% |
0% |
4% |
Total (Number) | 25,816 | 45,740 | 31,278 | 7,942 | 2,320,297 |
Conclusion
It is important to remember that the data outlined above is based on the Electoral Divisions (ED) and therefore will not highlight smaller areas of disadvantage within the ED. The data does highlight differences in the profile of the areas of Swords, Balbriggan, Ballymun/Whitehall and separately the Ballymun area covered by the ED Ballymun A/D. Each area has unique aspects to its profile and at the same time the areas have much in common and can differ from the national profile in various aspects. It will be necessary for the BJC to consider these differences and common aspects when developing specific actions/project over the coming years. The area in Dublin North where the BJC delivers services and projects is diverse, containing both rural and urban communities. The area is one that has a growing population which is expected to continue to grow over the coming years. The area contains many groups that face challenges in terms of their access to the labour market, health, quality of life, etc. As services and projects are developed it would be useful to design them around the needs of groups facing challenges living in the area.
The focus of the work of the BJC is on employment, career development and related areas. Given the complex inter-relationship between factors that influence labour market exclusion considerations could be given to developing actions, projects and services while not direct labour market interventions help address the complex factors which inhibit labour market participation. The data outlined above shows there are groups and areas that would benefit from a more integrated approach. In an idea situation such an approach should be developed in partnership with others. This document provides a brief profile of the areas covered by the work of the BJC. There are many external factors that will have an influence on the future development of these communities such as climate change, developments in technology and AI, housing, immigration, etc. the BJC will have to consider how these are likely to influence the development of the individuals and communities profiled above.